


Machine Learning
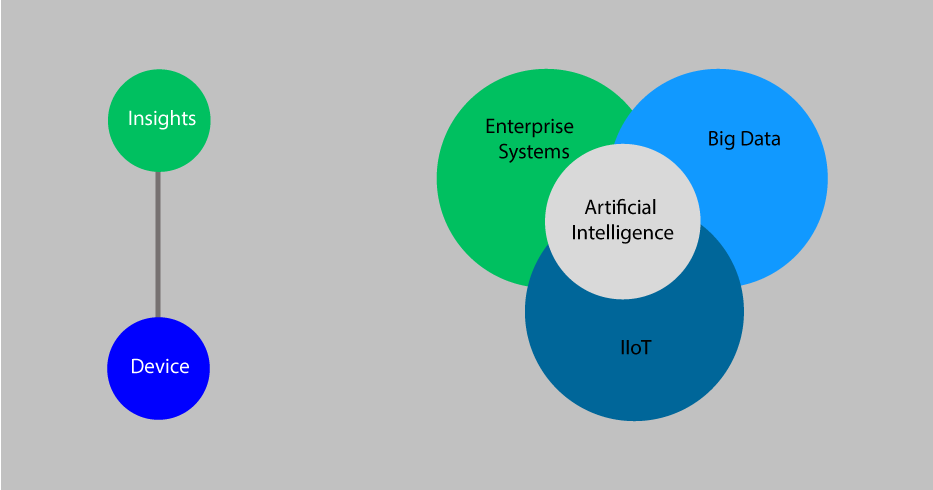
Machine Learning is an application of Artificial Intelligence that provides systems the ability to automatically learn and improve from experience without relying on rules-based programming. It is the science of making computers learn and act like humans.
There are four types of machine learning algorithms:
- Supervised Learning: Supervised Learning is the output of a model for a given test data is known. In this type of learning, the model is trained with well-labeled data with the expectation that the model learns from trained data and predicts the outputs.
Supervised Learning can be placed into two categories: - Classification
- Regression
- Unsupervised Learning: Unsupervised Learning is the type of learning for which the output for the given test data is unknown. The model is trained with information which is neither classified nor labeled. The model is expected to act on the information without guidance.
Example: Clustering Algorithms. - Semi-Supervised Learning: Semi-Supervised Learning is in between Supervised and Unsupervised learning. *The training data consists of both the labeled and unlabeled data used in the real-world, this is the type of data which is available.
- Reinforcement Learning: With Reinforcement Learning, the model is exposed to an environment that receives training by trial and error method. This method allows the models to automatically determine the ideal behavior within the context to increase the performance.
- Define Different Type with examples
- What kind of problem we can solve using this - List Industry and Problems (One or two lies)
- Proven use cases in Health, Energy, Oil & Gas and Consumer
- Any Architecutrual Digram
- Limitation
- Implementation Steps
| Types Of Machine Learning | Oil and Gas | Health | Energy | Consumer |
Supervised |
|
|
|
|
Unsupervised |
|
|
|
|
Semi-Supervised |
|
|
|
|
Reinforcement |
|
|
|
Dynamic Pricing of Retail Markets uses Reinforcement Algorithm. |
Scikit-Learn
- Scikit-Learn is a robust, free machine learning library which is a perfect library to use in any end-to-end to machine learning project.
- Scikit-Learn is built on top of several math and data Python libraries like numpy, SciPy, matplotlib, Pandas etc.
- Scikit-learn is not concerned with the loading, manipution and visualising of data. It is completely focused on machine learning, such as data modeling.
- Scikit-learn's current version is 0.21.1.
- Scikit-Learn is open-source.
- Scikit-Learn is a free library for Python.
- Some popular models provided by Scikit-learn include:
- Clustering
- Regression
- Decision Trees
- Neural Networks
- SVMs
- Naive Bayes
- J P Morgan uses Scikit-Learn widely in all parts of the banks for classification, predictive analysis, etc.
- Booking.com uses Scikit-Learn in its machine learning algorithms for recommending hotels and destinations to the customers.
Limitations:
- Scikit-Learn has less focus on the statistics than that of R programming.
- Deep Learning and Reinforcement Learning are currently out of scope for the objectives of Scikit-Learn.
K-Nearest Neighbour using Scikit-learn:
K-Nearest Neighbor Classification Algorithm stores all the available cases and classifies new cases, based on the similarity measure.

- DBSCAN Clustering Algorithm using Scikit-learn:
*Density Based Spatial Clustering of Applications with Noise, clusters the points which are close to each other based on some distance metric and points the outliers which are low-density regions.

Pandas
Python Data Analysis Library
- An open-source python library, providing easy, flexible, fast and expressive data structures which can work with structured data (tabular, multi-dimensional) as well as time series data.
- Provides powerful data analysis tools which help in real-world data analysis.
- There are two primary data structure of pandas:
- 1-dimensional -Series)
- 2-dimensional – Data Frames.
- Pandas is built on top of NumPy and is intended to integrate well with other 3rd party libraries.
- Current stable version of Pandas is 0.24.2.
- Pandas support Python programming.
- Import features of Pandas:
- Can easily handle missing data values.
- Automatic and Explicit data alignment.
- Robust IO tools for loading data from flat files
- Time-series specific functionality.
- Pandas is an ideal tool for a data scientist who works with data in different stages like data munging, cleaning, analysing, visualizing etc.
- Predicting the stocks, Advertising, Natural Language Processing are some of the applications of the Pandas.
NUMPY
- Numpy is a general-purpose package for array processing and scientific computation with Python. It provides a high performance multi-dimensional array object and tools to work with arrays.
- Some important features of numpy include:
- powerful N-dimensional array object. (numpy.ndarray).
- Broadcasting Functions for variables and arrays. (Element-wise operations).
- Tools for integrating C/C++ and Fortran codes.
- Applications in linear algebra, Fourier transform and has high capability to generate random numbers.
- NumPy’s current version is 1.16.3.
- NumPy is an open source for Python programming language.
- American Express, Facebook and JPMorgan Chase are some companies who use Numpy.
Limitations:
- Numpy is not supported within Google App. Engine applications. Therefore, we cannot create applications with any Google App.
- Since Numpy is written in C, it is deemed as an “unsafe” partly.
MATPLOTLIB
- Matplotlib is a 2D plotting library for Python programming language.
- Matplotlib can produce high quality figures in a variety of formats.
- Matplotlib is a multi-platform data visualization library built on NumPy arrays and designed to work with the broader SciPy stack.
- Matplotlib greatest is its visualization capacity,allowing visual access to huge amounts of data in easily digestible visuals. It tries to simplify the easy things and make the difficult things possible.
- Matplotlib’s stable version is 3.0.3.
- Matplotlib is an open-source.
- Matplotlib consists of several plots like line, bar, scatter, histogram, etc.
- Matplotlib can be used in Python Scripts, the Python and IPython shells, the Jupyter notebook, web application servers and graphical user interface tools.
- Matplotlib’s visualizations are used in stock market analysis, weather forecasting etc.
Limitations:
Matplotlib is extremely limite, regarding interactive and animated visualization.

A simple plot using matplotlib.


SEABORN
- Seaborn is a graphic library built on top of Matplotlib and closely integrated with pandas library.
- Seaborn provides a high-level interface for drawing attractive and informative statistical graphics.
- Seaborn’s current version is 0.9.0.
- Seaborn is open-source.
- Seaborn has a support for Python programming language.
- Some important functionalities that seaborn offers include:
- Automatic estimation and plotting of linear regression models for different kinds of dependent variables.
- Structuring multi-plot grids, high-level abstractions, provided to build the complex visualizations easily.
- Specialized support for categorical variables to show observations or aggregate statistics.
- Easily switched between different visual representations that can be parameterized with the same dataset-oriented API.
- Creates fully polished customised plots with additional steps.
- Seaborn is used for plotting kernel density estimates, building heatmaps etc.
- A multi bivariate KDE map

- Grouped Violin plots using seaborn

- Time Series plot with error bands

- Annotated Heatmaps using seaborn

TensorFlow
- TensorFlow is a free, end-to-end open source platform for machine learning.
- TensorFlow is a computation framework for building machine learning tools.
- TensorFlow provides a different toolkit that allows you to construct models at preferred level of abstraction.
- TensorFlow’s stable version is 1.13.1. 2.0.0 preview release is available.
- TensorFlow supports Python Programming.
- Some use cases of TensorFlow include:
- Voice/Sound Recognition
- Text Based Applications
- Image Recognition
- Time Series
- TensorFlow consists of the following two components:
- a graph protocol buffer
- a runtime that executes the (distributed) graph.
- Smart Retail Checkout with Object Recognition uses TensorFlow.
- TensorFlow is used to develop digital and predictive models in Oil and Gas Equipment Monitoring and Analysis.
- TensorFlow is used to detect Breast Cancer.
- TensFlow can be accomplished by predicting energy consumption of a building.
Limitations:
TensorFlow lags in speed and usage compared to its competitors.
| Library Name | What is it use for |
| Scikit-learn | Scikit-Learn machine learning library provides a wide range of supervised and unsupervised learning algorithms to build machine learning models. |
| Pandas | Pandas is used for data munging (data cleaning and preparation to input into the models) and also allows fast analytics. |
| Numpy | Numpy is used for scientific computing. It provides a high performance, multi-dimensional array. It also provides wide ranges of functions to manipulate and compute those arrays. |
| Matplotlib | Matplotlib is used for 2D graphs and plots. |
| Seaborn | Data visualization library built on top of matplotlib. It provides additional plot type and provides a better look compared to the traditional matplotlib plots. |
| TensorFlow | TensorFlow is a machine learning library which is used in building and training machine learning models. It helps in building Classification, Prediction etc. models. |
